
Case Study on the design optimization of the positive pressure operating room

Choosing the position of the patient on the surgical site
After validating the numerical simulation results, modifications were made to the investigated operating room by considering four distinct positions for the patient on the surgical bed. The four distinct positions mentioned are chosen as the basic models to determine the optimal operating bed position. This is essential because the operating table needs to be centrally located within the room’s four walls. This central placement ensures there is sufficient space around the table for other necessary operating equipment and tables. These positions include (1) the original orientation with the patient lying on the surgical table at 0 degrees (Org_0°), (2) the patient lying on the surgical bed at 90 degrees (Mod_90°), (3) at 180 degrees (Mod_180°), and (4) at 270 degrees (Mod_270°), as depicted in Fig. 2. The CO2 concentration in indoor air and its associated health implications are typically defined within the range of 400–1000 ppm, which aligns with ASHRAE standards and previous research58, indicating good air exchange in occupied spaces. Exceeding 1000 ppm can lead to adverse effects such as headaches, dizziness, nausea, and other symptoms. To determine the optimal patient location on the surgical table, CO2 concentrations are initially compared for the patient-only model under varying supply inlet velocities of 0.53 m/s, 0.75 m/s, and 0.82 m/s, as illustrated in Figure S3. These velocity variations can cause the direct increasing effect of ACH (33, 47, and 52 ACH) and room pressure (5.58, 11.27, and 12.36 Pa) as the same relation in Fig. 9. The decay in CO2 concentration correlates directly with the supply velocity and room pressure; higher velocities and pressures result in more pronounced reductions in CO2 concentrations across different patient positions within the operating room. All CO2 concentrations are assessed as average values across the entire operating room domain.

Comparison of CO2 concentration in four different schemes with three different velocities: (a) only patient model, and (b) two staffs model including patient.
Furthermore, the effect of CO2 concentration decrease is analyzed based on two computational models: one with only the patient and the other with two staff members including the patient. This analysis encompasses four different schemes across various supply velocities, as illustrated in Fig. 9. During durations of over 400 s and 600 s, the CO2 concentration levels reached stable levels in both the patient-only model and the two-staff models. The differing durations for stabilization can be attributed to the higher release of contaminants resulting from multiple individuals present in the operating room. Therefore, the impact of surgical staff on contaminant concentration emerges as a critical parameter in addressing surgical site issues. Although all the CO2 concentration trends decrease under the acceptable CO2 level, one of the significant trends in the modified 90˚position (Mod_90˚) can give the lowest concentration level compared with other positions.
Respiratory particles are small enough to facilitate the airborne transmission of microorganisms within them, thus as aerosol particles59. To calculate DPM concentration, the primary methods involve quantifying particles emitted through human actions such as speaking and breathing, which generate varying numbers of particles per second. Figure 10 analyzes the particle deposition effect from only one patient by calculating the breathing system in four schemes according to various velocities concerning pressure. Based on the numerical simulation results, it can be observed that low supply velocity cannot reduce DPM concentration in all schemes except from the modified position at 90˚ as described in Fig. 10. Furthermore, DPM concentration in the Mod_180° and Mod_270° positions exhibited increasing deposition over time, despite high supply velocities of 0.75 m/s and 0.82 m/s. This is attributed to the contaminant source originating from the patient’s mouth being situated away from the exhaust outlets in these models. To indicate the clear DPM concentration effect, four different schemes are compared with various velocities, as shown in Figure S4. The DPM concentration trends inside the operating room are nonlinear due to variations in the position of the contaminant source across different schemes. This variability can result in particle escaping effects from the different exhaust outlets. Additionally, it was noted that particle concentrations did not exhibit the same trend as CO2 due to their distinct dynamics and rates of deposition. Among these four schemes, the Org_0˚ and Mod_90˚ schemes can extract the lowest DPM concentration decay trends and these trends are nearly identical at the supply velocities of 0.75 m/s and 0.82 m/s. On the other hand, DPM concentrations at Mod_90˚ can be reduced more than in the Org_0˚ scheme at 0.53 m/s. Therefore, according to DPM concentration results, the modified position at 90˚ scheme (Mod_90˚) shows better performance than the other schemes.

DPM concentration from only patient in the operating room with different velocities, 0.53 m/s, 0.75 m/s, and 0.82 m/s.
To highlight the optimal patient position on the surgical table, the number of particles emitted during the breathing process, with a particle size of 0.5 µm, is compared across the entire room volume, as illustrated in Fig. 11. The particle deposition numbers at only the patient model are nearly the same for Org_0˚ and Mod_90˚, especially high supply inlet velocities. However, the particle deposition effect is quite different when the number of people increases inside the operating room. The number of particles in the Mod_90˚ scheme is smaller than in the Org_0˚ scheme when particle sources increase. This is because the Org_0˚ scheme has only one exhaust outlet near the patient’s head, while the Mod_90˚ scheme is positioned between two exhaust outlets. Hence, it is crucial to take into account the patient’s position concerning the placement of exhaust outlets. According to the observation results of CO2 and DPM concentrations and the number of particles per total volume inside the investigated operating room, the modified position at 90˚ is the best patient location on the surgical table with the lowest number of particles and minimum concentrations in reducing SSIs. These lowest amounts of existing particles and minimum concentrations can help achieve a safe, clean zone in the operating room, especially regarding SSI issues.

Comparison of the number of particles per total volume at only the patient model and two staff including the patient.
Investigation of contaminant effect according to the surgical staff
After determining the best patient position on the surgical table to be the modified position at 90˚, CO2 concentrations are calculated for eight configurations. These calculations consider different numbers of surgical staff and various supply velocities (0.36 m/s, 0.53 m/s, 0.75 m/s, and 0.82 m/s) that can get room pressures of (2.58 Pa, 5.58 Pa, 5.89, 11.27 Pa, and 12.36 Pa) as illustrated in Fig. 12. These eight configurations are denoted as follows: only patient, two staffs, four staffs, six staffs, eight staffs_M1, eight staffs_M2, ten staffs_M1, and ten staffs_M2, including the patient, as shown in Fig. 3. At a supply velocity of 0.36 m/s, CO2 concentrations increase to over 1000 ppm when ten healthcare staff are inside the operating room, and they approach 1000 ppm when eight staff are present. This indicates that the operating room lacks sufficient air exchange when the staff count exceeds eight people, particularly when the supply inlet velocity is 0.36 m/s, and the room pressure is 2.58 Pa. However, the operating room maintains a good air exchange level, with CO2 concentrations remaining below 1000 ppm in the indoor environment, even when ten staff members are present, provided the supply velocity increases with high positive room pressure. Hence, supply inlet velocity is a critical parameter for achieving a favorable indoor air environment, as it directly impacts room pressure. This relationship is evident as room pressure increases significantly, ranging from 2.5 to 12.36 Pa, with variations in supply inlet velocity from 0.36 to 0.82 m/s.

CO2 concentration at eight configurations with different velocities, 0.36 m/s, 0.53 m/s, 0.56 m/s, 0.75 m/s, and 0.82 m/s.
Furthermore, the CO2 concentration decay in the eight staff_M1 configuration exhibits an unstable effect across all velocity variations. This instability arises because the surgical staff is positioned between the patient and exhaust outlet2 and outlet3, which can disrupt airflow and create turbulent effects inside the operating room. Figure S5 represents the turbulent formation around the patient mouth and head due to the positioning of the surgical staff. Despite small turbulence occurring near the patient’s head in all eight configurations, there is high turbulence from the mouth area to the patient’s head area in the eight staff_M1 configuration model. This high turbulence can increase the SSI problem because contaminants get trapped within this turbulent flow before leaving the exhaust outlets. Therefore, the positioning of surgical staff is an important parameter in reducing the SSI issue.
The operating area requires cleanliness to the highest possible standard, with a requirement of 10,000 class and a maximum of three distinct particle sizes permitted inside the room. Therefore, in this study, three different particle sizes such as 0.5 µm, 1 µm, and 5 µm together are used for the calculation of aerosol number of particles from the breathing and speaking model. The maximum allowable particles are also different as 352,000/m3, 83,200/m3, and 2,930/m3 according to the standards. All the particle numbers are recorded until 900 s based on the volume of one cubic meter inside the operating room. As indicated in Fig. 13, the investigated operating room can maintain particle levels below the acceptable maximum per cubic meter, even when occupied by ten healthcare workers, across all particle sizes (0.5 µm, 1 µm, and 5 µm). The particle deposition rate decreases as the supply velocity increases in all configurations except for one, such as eight staff_M1, as shown in Fig. 13 (a) and (b). In the eight staff_M1 configuration, two surgical staff members are standing near the patient’s head, which disrupts the extraction of aerosol particles due to the high turbulence airflow between outlet2 and outlet3 as mentioned earlier in Figure S5.

Comparison of the number of particles from eight configurations with various velocities and particle diameters: (a) breathing model and (b) speaking model.
In addition, there are two effects according to Brownian motion and Saffman’s lift forces acting on the particles based on their particle size. When the particle is less than 1 µm, high Brownian diffusion can be caused47 and Saffman’s lift force can be increased if the sub-particles are between 0.1 µm and 1 µm25,48. This high Brownian diffusion can result in greater net movement of particles from their starting point, and Saffman’s lift force also causes increased acceleration, moving the particles more effectively. Therefore, the total number of particles per cubic meter is larger at the smallest particle diameter of 0.5 µm compared to the other two particle sizes of 1 µm and 5 µm. According to CO2 concentration and the number of particle depositions, the positions of the surgical staff and exhaust outlets are also important parameters for removing contaminant aerosol particles.
Investigation of particle dispersion according to without and with mask
A surgical face mask is required for entry into the operating room in most contemporary hospitals. Therefore, this research studies the effect of mask usage on airborne bacterial counts near the surgery site by comparing masked and unmasked models, as shown in Fig. 14. The comparison of the particle dispersions from eight configurations (i-viii) while wearing and not wearing a mask in the breathing model, with a particle diameter of 0.5 µm, supply velocity of 0.56 m/s, and room pressure of 5.89 Pa as described in Fig. 15 (a) and (b). In Fig. 15, the red-colored highlight represents the crucial surgical area on the operating table. This area needs to be kept clean to reduce the risk of infection with open wounds. Therefore, the particle-releasing effect is tracked from 1 to 7 s to investigate the initial particle movement.
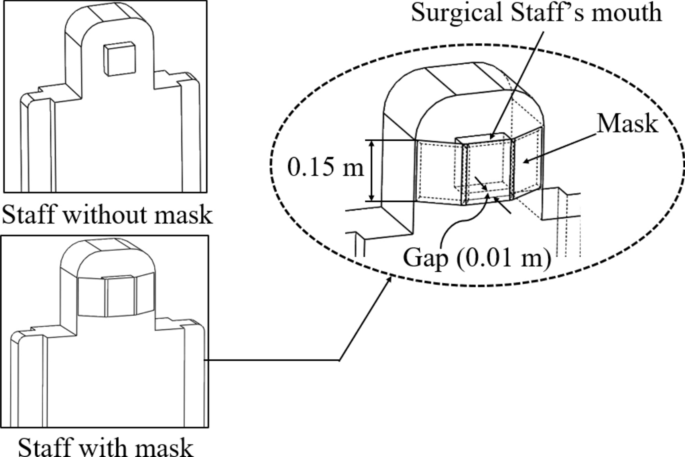
Masked and unmasked models of surgical staff.

Top views of the particle dispersion of eight different configurations in the investigated operating room with a diameter of 0.5 µm at 7 s: (a) while not wearing the mask and (b) while wearing the mask.
All the particles moved outward from the surgical table, originating from the contaminant sources of the patient and surgical staff, without dispersing near the patient’s body, as shown in Fig. 15. Similarly, the movement of all the particles from the mouths of the patient and surgical staff was directed upward and away from the surgical table, as illustrated in Figure S6. This clean surgical area is maintained due to the direct airflow pattern from the supply inlet area to the operating area. In summary, it was noted that the investigated operating room could safely accommodate up to ten staff while maintaining acceptable cleanliness and a good air change rate, provided the supply velocity is above 0.56 m/s and the room pressure is 5.89 Pa. Although wearing a mask can create a cleaner area by controlling particle dispersion around the operating table compared to unmasked operations, it does not significantly influence the dispersion route of exhaled particles, as shown in Fig. 15 (a) and (b). Therefore, it can be observed that wearing a mask is not an effective solution for reducing surgical site infections. This finding is supported by previous research, which shows no difference in SSIs between surgeries performed with and without masks60,61,62,63,64.
Energy consumption
In the HVAC system, the AHU fan is the most important component and a significant energy consumer65,66. It can use approximately 40% of all electricity in HVAC systems67. Therefore, the energy consumption is mainly calculated by multiplying the volume flow rate and pressure difference from the supply fan. The volume flow rate is divided by the total room volume to get the air change rate, ACH of the operating room. The supply surface area is multiplied by the supply velocity to approach the relevant volume flow rate into the OR. In Fig. 16, the parameters of volume flow rate, ACH, and room pressure are directly proportional to the supply velocity. The power consumption is maximum at the supply velocity between 0.53 m/s and 0.75 m/s; thereafter, the power decreases even as the velocity increases. As an obvious result, ACH is the main parameter in the clean room design, and it can be maintained by adjusting supply velocity. In addition, the average room temperature varies around 22˚C inside the OR with all the different airflow rates, which is under the acceptable temperature limit.

Relation of volume flow rate, ACH, room pressure, and power consumption according to the supply velocity in the ventilation system of the investigated OR.
The maximum operating air volume and fan speed, 1.32 m3/s and 4,100 rpm respectively, are determined based on the selected fan type for the operating room, with the actual operating point in the installation shown in Fig. 17. The investigated operating room operates beyond the fan’s operating point at high velocities of 0.75 m/s and 0.82 m/s under current conditions. The high velocity effect can result in overpressures of 11.27 Pa and 12.36 Pa, exceeding the desired design standard of 5 Pa. Although the investigated operating room is operating with the same power consumption near the fan operating point, it may result in higher volume flow rates of 1.78 m3/s and 1.95 m3/s. According to fan laws, the supply fan generates high airflow rates of 1.78 m3/s and 1.95 m3/s, requiring it to operate at 4,298 rpm and 4,577 rpm, respectively, which is beyond the maximum fan speed of 4,100 rpm. This high fan speed and overpressure effect can lead to unstable operation, reduced fan efficiency, and lifespan, as well as increased noise and vibration. A high volume airflow rate of 1.95 m3/s can reduce fan efficiency by about 7%, requiring the supply fan to operate at overspeed to supply the required amount of air. This can lead to increased vibration and noise in the ventilation system. Therefore, this overpressure effect needs to be maintained in the optimum condition and shows that the operating room needs to check the necessary supply velocity and room pressure for the relevant airflow rate of the supply fan.

Variation of power consumption with volume flow rate.
Improvement modification of the supply inlet area
To adjust the overpressure effect, modifications to the supply inlet area are considered to ensure operation within the operating point, taking into account other necessary parameters such as ACH, room pressure, CO2 and DPM concentrations, and the maximum number of particles with varying numbers of surgical staff inside the OR. The original surface area of the operating room denoted as A0, is 2.36 m2, while the two modified surface areas, denoted as A1 and A2, are 5.12 m2 and 7.6 m2, as shown in Fig. 18 (a)-(c). When the supply area increases, high positive room pressure can be obtained with the low velocity effect as compared in Fig. 18 (d). In the original operating room with a supply surface area of A0, the inlet velocity should be set at 0.56 m/s, maintaining a room pressure of 5.89 Pa and achieving 35 ACH, to address the issue of the optimum overpressure effect and to preserve the lifespan and efficiency of the supply fan. Additionally, as the improved performance, the modified supply surface areas of A1 and A2 can operate with minimal velocity effects of 0.25 m/s and 0.17 m/s, respectively, maintaining room pressures of 5.55 Pa and 5.66 Pa, and achieving 34 ACH and 35 ACH. This indicates that the modified operating rooms can maintain acceptable cleanliness levels without imposing any harmful effects on the supply fan. Moreover, the larger size of the supply inlet area can provide a cleaner environment not only around the patient’s body in the surgical area but also for the surgical staff standing around the surgical table as shown in Figure S7 of the airflow pathlines. This cleaner zone tends to enhance the performance of surgical staff by providing a safer working environment, thereby reducing SSI cases and extending the life span of the operating room’s ventilation system through adjustments in minimum ACH, power consumption, and optimal room pressure.

Modification of the operating room: (a) original supply surface area, A0; modified supply surface area, (b) A1, (c) A2 and (d) variation of supply velocity and room pressure according to the supply area.
link
")