


Datasets collection
In the selection process of furniture models for this study, it screens based on key factors such as diversity, functionality, and practical application needs. This study chooses the 3D- Furniture Shape with TextURE (FUTURE) dataset as the research data source. This dataset includes 20,240 real-scene images and 9,992 high-quality 3D furniture model images. It covers various furniture types like sofas, chairs, desks, and dining tables. It also features rich material options and functional designs to meet different users’ customization needs46. Additionally, the dataset provides high-quality texture information and detailed attribute annotations. This ensures clear textures and rational spatial layouts in the furniture models, making them suitable for high-quality VR experiences. Each model includes detailed functional descriptions to support personalized design and reflect users’ diverse preferences in design style, comfort, and size. Therefore, this dataset meets the needs of the study. To ensure the diversity of training data and the representativeness of testing data, the dataset is divided into training and testing sets at a ratio of 8:2.
To gain a deep understanding of users’ needs and preferences in customized furniture design, this study designs a questionnaire with multiple dimensions and both objective and subjective measurement sections. The objective section uses a 5-point Likert scale to quantify users’ specific needs for furniture functions, such as safety, comfort, and ease of control47. Users rate the importance of each function from 1 to 5 (1 means “not important at all,” and 5 means “very important”). These ratings provide highly objective quantitative data, helping designers accurately match user needs. The subjective section focuses on users’ emotional and aesthetic needs. It includes open-ended questions and self-assessment scales to capture users’ evaluations of furniture appearance, emotional attachment, and design style. Through open-ended questions, users can freely express their views and suggestions on furniture design. Although this part of the data is more subjective, it offers designers intuitive information about user preferences. The online questionnaire was distributed via the Sojump platform, with 150 questionnaires disseminated and 146 responses collected. Among these, 137 responses were valid, yielding a response rate of 91.3%, a reliability score of 0.89, and a validity score of 0.84, indicating robust data reliability and validity. The dataset encompasses both quantitative Likert scale ratings and qualitative free-text responses, comprehensively reflecting user preferences in functional and emotional requirements. By conducting a comprehensive analysis of these data and incorporating the Kano model for classification, the study identifies which functional requirements are fundamental for users, and which are expected or innovative needs. This feedback offers valuable insights and theoretical foundations for optimizing furniture design models, offering a deeper understanding of user expectations and enabling the development of more tailored and innovative design solutions.
To analyze the differences between different user groups in the demand of furniture interactive function, this study collects the basic demographic information of the respondents, and the specific groups are shown in Table 2.
This study uses gender, age, and income level as the basis for grouping. It mainly considers the differences in users’ furniture interaction needs. Gender can affect users’ focus on furniture functions, such as safety and convenience. Age determines users’ interaction methods with furniture. For example, young users prefer intelligence, while middle-aged and elderly users pay more attention to comfort. Income level affects the budget and demand tendency for personalized customization. This grouping method helps identify the preferences of different groups. Thus, it optimizes the furniture interaction design and improves personalized adaptability.
Experimental environment and parameters setting
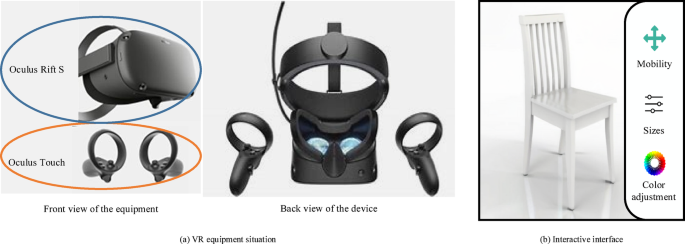
The VR and IoT-integrated system developed in this study is tested in a highly configured experimental environment to provide an immersive furniture customization and interactive design experience. The experimental hardware setup includes the Oculus Rift S head-mounted display, high-quality stereo audio headphones, Oculus Touch hand controllers, and a smart sensor network. These devices ensure natural interaction and real-time feedback within the virtual environment. The system runs on a computer with 16GigaByte (GB) of memory, an Intel Core i7-7700U processor, and an NVIDIA GeForce GTX 1070 graphics card to guarantee efficient image rendering and real-time processing. The software environment is based on the Windows 10 Professional operating system, with model development conducted using the TensorFlow 2.8 DL framework and Python 3.12 programming language. Compute Unified Device Architecture (CUDA) 11.2 and CUDA Deep Neural Network (CUDNN) 8.1 libraries are utilized to accelerate the neural network training process. The virtual environment is developed using Unity 3D, enabling seamless integration with the furniture design model. Users can view and adjust furniture designs in real-time through VR devices. IoT devices are connected to smart home systems to synchronize real-time data and dynamically adjust design schemes, enhancing the user experience. During the experiment, participants interact with virtual furniture by wearing the head-mounted display and using hand controllers. Their actions and feedback are recorded by IoT devices, categorized, and analyzed using the Kano model to optimize the functionality and innovation of furniture designs. Specifically, users enter the VR environment by wearing the Oculus Rift S head-mounted display and interact with furniture in the first-person perspective. Although the virtual environment itself cannot directly provide physical tactile feedback, through precise visual presentation, users can view the furniture from multiple angles. They can adjust the height of the chair, the softness of the cushion, and the angle of the backrest via the virtual interface, intuitively experiencing the impact of different designs on comfort. The VR equipment is shown in Fig. 6.

This study employs GAN to optimize personalized furniture design, aiming to generate high-quality furniture design images. The GAN model consists of a Generator and a Discriminator. The Generator takes a random noise vector as input, maps it through a fully connected layer to a feature map of size 128 × 8 × 8, and then up samples it to 128 × 128 × 3 through four layers of transposed convolution. This process ultimately produces high-resolution furniture images. Each transposed convolution layer uses the ReLU activation function to enhance non-linear expression, while the output layer uses the Tanh activation function to normalize pixel values to the range [−1, 1], ensuring the stability of the generated images. The Discriminator receives input images of size 128 × 128 × 3 and extracts deep features through four convolutional layers (with a kernel size of 4 × 4 and stride of 2). The number of channels increases progressively (64, 128, 256, 512). The output is then flattened to produce a binary classification probability, determining whether the input image is a real sample or a generated one. Each convolutional layer in the Discriminator uses the LeakyReLU activation function (α = 0.2) to enhance non-linear feature extraction and avoid the vanishing gradient problem. This study uses the Adam optimizer (β1 = 0.5, β2 = 0.999) with a learning rate of 0.0002 and a batch size of 64, training for 1000 epochs. To improve training stability, a progressive training strategy is employed. The resolution starts from low (e.g., 32 × 32) and gradually increases to the final high resolution (128 × 128). This allows the Generator and Discriminator to learn image structures and details step by step. By alternately optimizing the Generator and Discriminator, the authenticity and diversity of the generated images are enhanced.
Performance evaluation
To verify the furniture customization performance of the AI-assisted design system optimized by GAN, this study selects Mask R-CNN, RL, evolutionary algorithm-based methods, DeepLabv3+, Spatial Transformer Generative Adversarial Network (ST-GAN), and GAN algorithms. The results generated by each model are compared in terms of recall, precision, F1 score, and mean Average Precision (mAP). The specific results are shown in Fig. 7.


Comparison of different model generation effects.
In Fig. 7, IoT-AI-GAN demonstrates significant advantages across all evaluation indicators, especially in recall (0.95), precision (0.93), F1 score (0.93), and mAP value (0.90). These indicators indicate that IoT-AI-GAN can accurately capture and meet user needs in the furniture customization process, providing high-quality and precise design solutions. A high recall means the system can effectively identify design solutions that meet user needs, while precision shows a very high match between these solutions and user needs. The F1 score, as a comprehensive evaluation indicator, demonstrates that IoT-AI-GAN achieves an ideal balance between precision and recall. The high mAP value also indicates strong performance in multi-class object detection, enabling better customization of furniture designs that meet diverse user needs. In comparison, although Mask R-CNN and ST-GAN perform well, they still fell short of IoT-AI-GAN. Mask R-CNN has a recall of 0.88, precision of 0.85, F1 score of 0.87, and mAP of 0.82. While its precision and recall are relatively close to IoT-AI-GAN, it is slightly inferior in other comprehensive indicators, especially the mAP value, suggesting it might not be as meticulous as IoT-AI-GAN in handling complex furniture design needs. ST-GAN has a recall of 0.90, precision of 0.88, F1 score of 0.89, and mAP of 0.87. Although its overall performance is good, it does not match the uniform superiority of IoT-AI-GAN across all indicators. RL (recall: 0.80, precision: 0.79, F1 score: 0.81, mAP: 0.78) and evolutionary algorithms (recall: 0.83, precision: 0.82, F1 score: 0.81, mAP: 0.80) show lower performance across all indicators, particularly in recall, precision, and mAP values. This indicates that these methods do not achieve the same level of high precision and recall in furniture customization design tasks. Although RL and evolutionary algorithms may perform well in some scenarios, their overall performance in this type of customization task still lags IoT-AI-GAN. Overall, IoT-AI-GAN’s comprehensive performance significantly outperforms other methods. It not only leads in all evaluation indicators but also better meets the design needs of furniture customization. It provided users with more precise and efficient design solutions, demonstrating its strong potential and advantages in intelligent furniture design.
The furniture generation effect of the AI aided design system based on GAN optimization is shown in Fig. 8.


Furniture generation effect.
In Fig. 8, from the perspective of design diversity, the system breaks through the limitations of traditional design methods. Especially in the design of chair backs, it features not only the usual tilt angles but also modern, unique shapes. This design innovation offers designers more creative options, meeting diverse style requirements and further promoting the diversity and personalization of furniture design. In terms of detail representation, the system precisely simulates the material texture of the armrests, allowing users to perceive a more realistic feel. Additionally, the structural design of the chair base demonstrates clear and varied design concepts. These details effectively enhance the realism and professionalism of the furniture components, resulting in high visual appeal and functionality of the generated design solutions. In summary, the system not only helps designers efficiently create high-quality design solutions but also significantly improves design efficiency and innovation. By accurately reproducing and innovating furniture design details, the GAN-optimized AI-assisted design system provides new technical support for the furniture design process, contributing to the intelligent and efficiency of the design workflow.
To evaluate the effectiveness of the GAN-optimized AI-assisted design system in furniture generation, this study employs a qualitative comparative assessment based on user feedback. Specifically, the evaluation is conducted across the following dimensions: behavioral operation functionality, language functionality, prompt functionality, social functionality, leisure functionality, comfort, convenient control functionality, visualization functionality, composite functionality, and safety. Each dimension is assessed using a five-point rating scale, aiming to comprehensively measure the performance of the system-generated furniture designs across various aspects. This approach helps validate the system’s effectiveness and practical applicability. The scores for furniture generated under the GAN-optimized AI-assisted design system across these dimensions are presented in Fig. 9.


Generate furniture scores on each dimension.
In Fig. 9, the qualitative comparative assessment of the GAN-based system reveals that different furniture styles exhibit varying performance across multiple dimensions. Behavioral operation functionality: Styles 3 and 6 perform exceptionally well, both scoring close to 4.5. This indicates that these furniture designs offer a smooth and intuitive user interaction experience that aligns with expected behavioral functions. Language functionality: All styles score below 4, suggesting that the current furniture designs have room for improvement in terms of language functionality. Prompt functionality: Style 3 achieves the highest score, demonstrating its effectiveness in guiding user operations and assisting users in task completion. Social functionality: Style 1 receives the highest rating, indicating its ability to enhance user interaction with the virtual environment, thereby increasing engagement and immersion. Leisure functionality: Styles 2 and 3 are rated highly, with users reporting that these furniture designs better fulfill emotional attachment needs, enhancing their affinity and appeal. Comfort: Styles 2 and 6 excel in this dimension, receiving high scores that reflect their ergonomic and user-friendly designs. Convenient control functionality: Style 3 achieves the highest rating, suggesting that its control mechanisms are simple, efficient, and user-friendly. Visualization functionality: Styles 1 and 6 receive high scores, indicating that their designs provide clear, intuitive visual representations that facilitate user comprehension and operation. Composite functionality: Style 3 performs well, with a score close to 4.5, highlighting its integration of multiple functionalities to meet diverse user needs. Safety: Scores across all styles remain balanced, with none falling below 3.5, suggesting that safety considerations are well incorporated into the design, providing a sufficient level of protection for users. In summary, the GAN-based furniture design system produces highly satisfactory results across multiple dimensions. Notably, behavioral operation, comfort, convenient control, and visualization functionality receive particularly positive user feedback, illustrating that the system delivers effective designs and a superior user experience in practical applications.
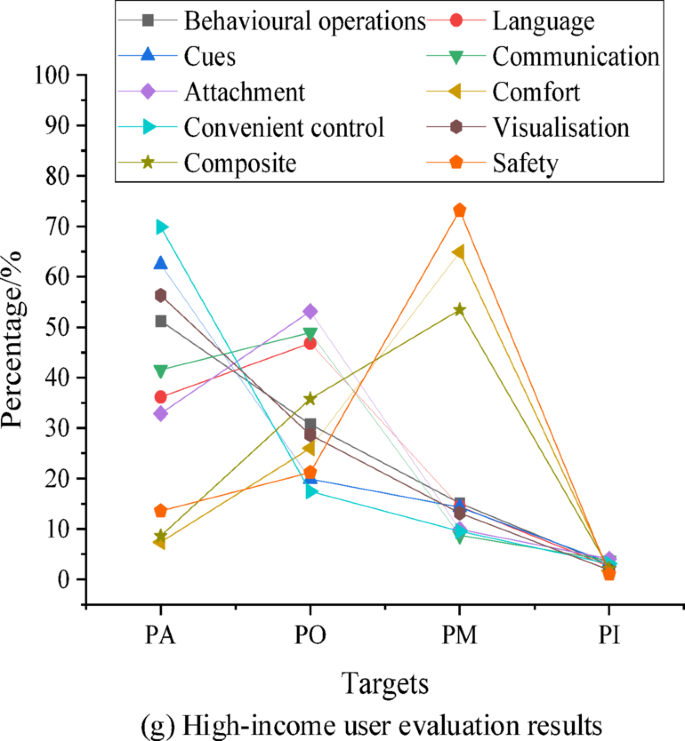
In the Kano model, the Proportion of Attractive Quality (PA) reflects the degree to which users respond to features that provide surprises or exceed expectations. These features greatly increase satisfaction when they are present, and do not cause dissatisfaction when absent. The Proportion of One-dimensional Quality (PO) measures users’ expectations for essential features that improve satisfaction when present but lead to dissatisfaction when absent. The Proportion of Must-be Quality (PM) indicates features that users consider mandatory; their absence causes strong dissatisfaction, but their presence does not substantially increase satisfaction. The Proportion of Indifferent Quality (PI) captures users’ lack of preference or perception toward certain features, meaning these features have minimal impact on satisfaction regardless of their presence. By analyzing these four ratios, it is possible to systematically understand and optimize various functions in furniture design, thus enhancing user experience and satisfaction. The evaluation results of the furniture customization interactive function based on the optimized AI-assisted design system are depicted in Fig. 10.

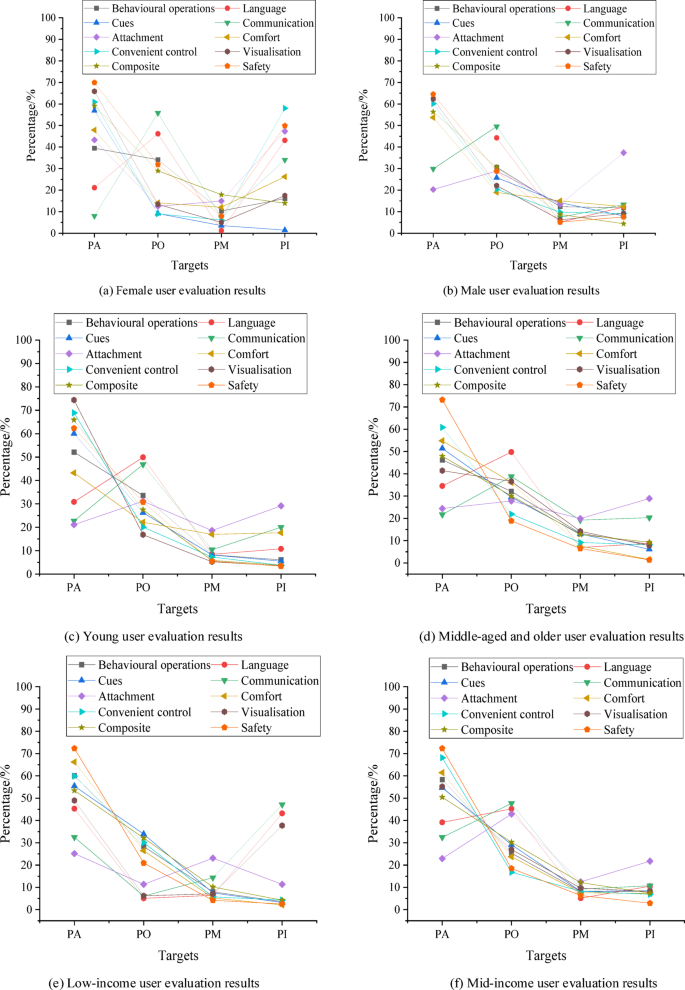

Evaluation results of furniture customization interactive function based on the optimized AI-assisted design system.
Figure 10 shows that at the gender level, in terms of the interactive functions of furniture customization, behavioral operation, prompt, comfort, convenient control, visualization, composite, and safety are considered attractive requirements for female users. Their PA scores are 39.47%, 56.88%, 47.88%, 60.88%, 65.84%, 59.07%, and 69.92%, respectively. This indicates that they expect to obtain a smoother, more intuitive, and more comfortable user experience through the intelligent design system, and these functions attract their interest and meet their requirements. The language and social functions are expected for female users, with PO scores of 46.15% and 55.81%, respectively. It suggests that female users hope the system can provide clear language guidance and social interaction to help them better understand the furniture design process and communicate effectively with other users or designers. This indicates that their expectations for these functions are aimed at improving the quality of interaction and the accuracy of the information, thus making them expected requirements. The idle function is considered an indifferent requirement for female users, with a PI score of 47.31%, meaning that female users pay less attention to these functions. They may think that these functions have little effect on furniture customization, or that their overall experience improvement is limited, so their demand for them is relatively neutral. Overall, female users’ requirements focus on improving interaction efficiency, comfort, and personalized design. Compared to female users, male users show a higher level of concern for practical and functional needs, such as the convenient control function, visualization function, and safety. They tend to prefer simple, direct, and efficient interaction designs, with lower demand for social and idle functions, demonstrating that their furniture customization needs are more oriented towards practicality and functionality. Considering visual effects and safety, male users also exhibit relatively stronger needs, suggesting that they place higher importance on the furniture system’s efficiency, safety, and stability.
At the age level, young users exhibit distinct preference characteristics in their evaluation of furniture customization interaction features. Firstly, the demand for visualization and convenient control functions is most prominent among young users, with PA values of 74.40% and 68.90%, respectively. It indicates that they place high importance on smart, convenient control methods and the aesthetic design of home products, reflecting their strong preference for technology and personalization. Secondly, the PA values for the prompt and composite functions are 60.01% and 65.89%, respectively, illustrating that young users prefer furniture products that offer multiple functions and enhance interactive experiences. Moreover, safety remains a key concern for young users, with a PA score of 62.30%, even though they lean more towards technological innovation. In contrast, the demand for idle and social functions is relatively lower, with PO scores of 31.15% and 46.87%. In short, young users’ requirements are focused on high technology, personalization, convenience, and safety, preferring intelligent furniture designs that align with modern lifestyles. In comparison to young users, middle-aged and elderly users are more inclined towards practical functions, with less focus on additional and social functions, reflecting their prioritization of the functional, comfort, and safety aspects of furniture. The specific scores are as follows. Middle-aged and elderly users have a PA score of 46.25% for the behavioral operation function, indicating a focus on convenient operation and functionality; They have a PO score of 49.75% for the language function, showing some expectation, though more emphasis is placed on practical operation functions compared to young users; They have a PA score of 51.40% for the prompt function, demonstrating a preference for features that provide clear guidance to improve usage efficiency. The attention to social functions is relatively low, with a PO score of 38.80%, illustrating that social interaction is not a major need for them. The PI score for idle functions is only 28.90%, displaying a lesser interest in non-essential features, with more focus on the core functions and practicality of the furniture. In terms of comfort, middle-aged and elderly users have a PA score of 54.80%, exhibiting high importance placed on the comfort of the furniture. The PA score for convenient control functions is 60.80%, suggesting a preference for convenient and efficient control methods to enhance the living experience. As for the visualization function, the PO score is 36.60%, indicating some demand for aesthetic appeal, but less emphasis on visual design compared to functionality. The PA score for composite functions is 47.90%, illustrating that they prefer furniture with diverse functions to meet various life needs. Lastly, in terms of safety, the PA score reaches as high as 73.20%, reflecting the strong emphasis that middle-aged and elderly users place on the safety of the furniture.
At the income level, low-income users’ attractive requirements are primarily focused on safety, behavioral operation, prompt function, comfort, convenient control, and composite functions with PA scores of 72.35%, 60.12%, 55.44%, 66.21%, 59.88%, and 53.44%, respectively. This indicates that low-income users are more likely to choose functions that directly enhance usability, comfort, and safety, rather than seeking additional decorative or social functions. In contrast, language, social, idle, and visualization functions are considered indifferent requirements for low-income groups, with PI scores of 43.2%, 47.1%, 40.38%, and 37.72%, respectively. This further suggests that the furniture choices of low-income groups are primarily based on cost-effectiveness and practical functionality, with lower demand for features that offer additional value or social interaction. Compared to low-income users, middle-income users are more attracted to visualization functions, with a PA score of 55.21%. Language and social functions fall under the expectation requirements for middle-income users, with PO scores of 39.14% and 47.65%, respectively. It illustrates that while these users do have some demand for language interaction and social functions in custom furniture, these functions are not their top priority. High-income users place more emphasis on practical and comfort-related functions, such as safety, comfort, and convenient control functions, while also having certain expectations for social and language functions. For additional and non-essential functions, although they have expectations, they are more focused on features that enhance the overall experience and safety. High-income users show strong attraction to behavioral operation functions, prompt functions, convenient control functions, and visualization functions, with PA scores of 51.23%, 62.45%, 69.87%, and 56.32%, respectively. This suggests that the presence of these functions markedly enhances user satisfaction, exceeding their expectations. Language and social functions are regarded as expectation requirements for high-income users, with PO scores of 46.82% and 48.92%. It denotes that these functions are seen as necessities in use, though not providing a surprise factor, their absence would lead to dissatisfaction. The PO score for idle functions is 53.14%, showing that high-income users have a relatively high expectation for additional functions, which, while not as important as practical features, play a role in enhancing the overall experience. Comfort, composite functions, and safety are all considered must-be requirements for high-income users, with PM scores of 64.89%, 53.45%, and 73.18%, respectively. This indicates that the absence of these functions would cause strong dissatisfaction, though their presence does not significantly increase satisfaction. These functions are fundamental conditions for high-income users when choosing furniture, especially safety and comfort, which are crucial for them.
The evaluation results of users’ importance and satisfaction of the furniture customization interactive function of the optimized AI-assisted design system are illustrated in Fig. 11.

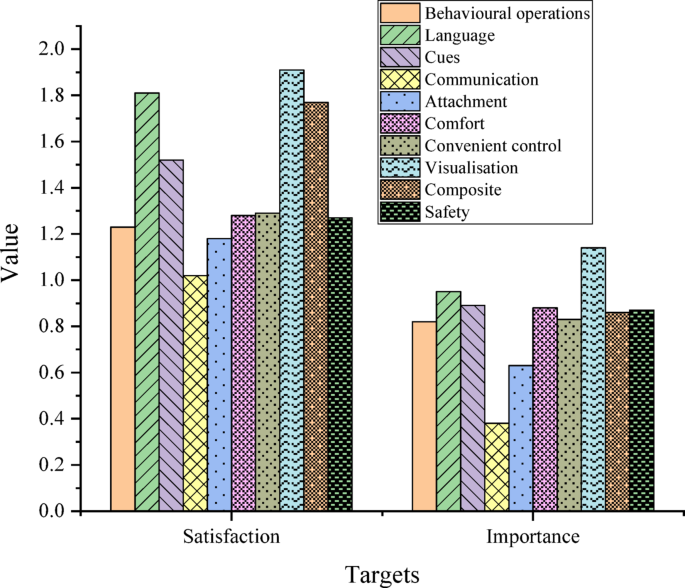
Evaluation results of satisfaction and importance.
The analysis of Fig. 11 shows that the visualization function in furniture customization ranks highest based on satisfaction and importance, scoring 1.91 and 1.14. This indicates that users attach great importance to the appearance and design of furniture. The language function also performs well, with satisfaction and importance scores of 1.81 and 0.95 respectively, reflecting a strong user demand for language support. The prompt function achieves satisfaction and importance scores of 1.52 and 0.89, respectively, demonstrating the critical role of immediate feedback and prompt information for users. The satisfaction and importance scores of the composite function are 1.77 and 0.86, emphasizing users’ demand for multifunctional furniture. In terms of safety, satisfaction, and importance scores are 1.27 and 0.87, highlighting the high concern of users for furniture safety. Additionally, the behavioral operation, comfort, and convenient control functions exhibit notable performance in satisfaction and importance, meeting user requirements across various dimensions.
The comparison results of the response speed of different algorithms are depicted in Fig. 12.

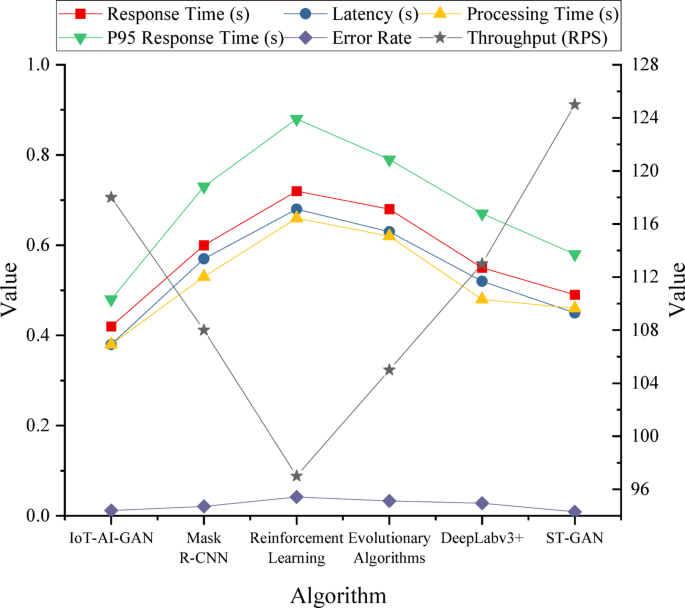
Response speed comparison results of different algorithms.
In Fig. 12, the experimental results reveal significant variations among algorithms across multiple performance metrics, including response speed, latency, throughput, processing time, P95 response time, and error rate. Specifically, the proposed IoT-AI-GAN algorithm demonstrates optimal performance in both response time (0.42s) and latency (0.38s), making it particularly suitable for applications with stringent real-time requirements. Comparative analysis shows that IoT-AI-GAN also achieves superior performance in processing time (0.38s) and maintains a low error rate (1.2%), indicating its high efficiency and stability. In contrast, ST-GAN excels in throughput (125 Requests per Second (RPS)), demonstrating exceptional capability in handling high-concurrency requests. Meanwhile, its competitive P95 response time (0.58s) and low error rate (0.9%) further validate its reliability for complex computational tasks. RL exhibits comparatively inferior performance, with higher response time (0.72s), latency (0.68s), and error rate (4.2%), suggesting limited suitability for high-load environments where user experience and system stability are critical. DeepLabv3 + and Evolutionary Algorithms demonstrate balanced performance across multiple metrics, serving as viable options for applications requiring moderate performance trade-offs, though they underperform ST-GAN and IoT-AI-GAN in specific indicators. In summary, ST-GAN and IoT-AI-GAN each present distinct advantages. The former is optimal for high-throughput and stability-demanding scenarios, while the latter is better suited for low-latency and rapid-response systems. Other algorithms, such as RL, show limited applicability in real-time critical tasks, whereas DeepLabv3 + and Evolutionary Algorithms provide stable performance for balanced requirements.
Discussion
This study introduces significant innovations and improvements compared to previous research, addressing the limitations of traditional furniture customization systems in terms of adaptability, flexibility, and the diversity of user needs. First, prior studies often focused on the application of a single technology, such as the IoT or AI, lacking systematic integration of these technologies to meet complex user needs. In contrast, this study combines IoT, AI, and VR technologies, using GAN to build personalized design models. This allows the system to generate optimized furniture design solutions in real-time based on different user needs. The integration of these technologies enhances the system’s adaptability and precision. IoT collects real-time user behavior data and environmental information, ensuring the system can dynamically adjust design solutions according to user needs and changes. GAN uses this data to generate personalized furniture design models, providing accurate and adaptable solutions. Meanwhile, VR technology offers users an immersive interactive experience, allowing them to intuitively view and adjust designs in a virtual environment, thereby increasing user engagement and interactivity. This combination of multiple technologies not only meets users’ personalized design needs but also provides a more intuitive and interactive design experience through VR, enhancing user participation and immersion. Second, this study conducts an in-depth analysis of the diverse needs of different user groups in furniture customization interactions, especially differences across gender, age, and income dimensions, filling the gap in previous research. Although earlier studies recognized potential differences in user needs, few systematically explored and incorporated these differences into the design process. Through detailed user need analysis, this study reveals the preferences of different gender, age, and income groups. For example, female users place more emphasis on comfort and visualization functions, while male users focus more on ease of control and safety. Such detailed analysis not only improves the relevance of design solutions but also enables the system to adjust designs in real-time based on user characteristics, achieving higher personalization and customization in furniture design. Additionally, traditional furniture customization systems often have simple functional modules lacking dynamic interaction with users. By integrating GAN and VR technology, this study enhances the flexibility and diversity of interactions between furniture and users. Users can intuitively adjust furniture designs in the virtual environment and refine their preferences based on real-time feedback. This innovation breaks through the bottleneck of traditional systems’ inability to adapt to changing user needs, significantly improving the system’s interactivity and flexibility. The main contribution of this study is the innovative combination of GAN with VR and IoT technologies to propose a new personalized furniture customization design model. Through this technological integration, the study not only achieves automation and personalization in the furniture design process but also increases user engagement and immersion, greatly enhancing the customization experience. Moreover, by analyzing user needs based on the Kano model, this study optimizes the practicality and user satisfaction of design solutions, providing a new theoretical framework and technical pathway for the field of furniture customization design. It holds significant academic and practical value.
link